Note
Go to the end to download the full example code.
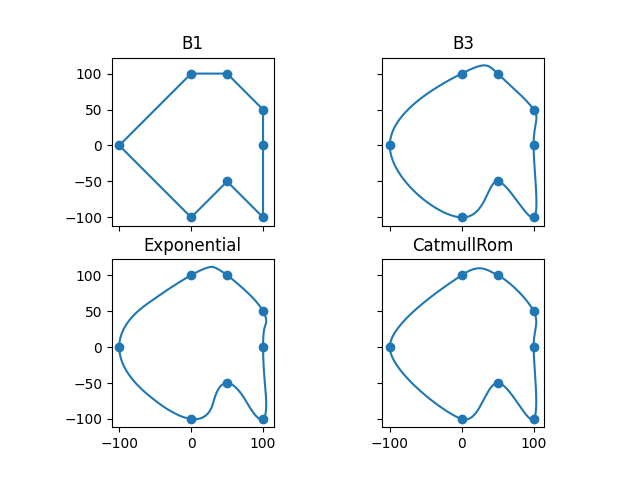
Closed interpolating splines
This example shows different closed interpolating splines.
import math

import matplotlib.pyplot as plt
import numpy as np
import splinebox.basis_functions
import splinebox.spline_curves

n, m = 2, 2
fig, axes = plt.subplots(n, m, sharex=True, sharey=True)

# Some pixel coordinates to interpolate
coordinates = np.array([[0, 100], [50, 100], [100, 50], [100, 0], [100, -100], [50, -50], [0, -100], [-100, 0]])

for i in range(n):
    for j in range(m):
        axes[i, j].scatter(coordinates[:, 0], coordinates[:, 1])

# The parameter values at which the spline is evaluated
x = np.linspace(0, len(coordinates), 1000)

for i, (name, basis_function) in enumerate(
    (
        ("B1", splinebox.basis_functions.B1()),
        ("B3", splinebox.basis_functions.B3()),
        ("Exponential", splinebox.basis_functions.Exponential(len(coordinates), 2.0 * math.pi / len(coordinates))),
        ("CatmullRom", splinebox.basis_functions.CatmullRom()),
    )
):
    curve = splinebox.spline_curves.Spline(len(coordinates), basis_function, True)
    curve.getCoefsFromKnots(coordinates)
    discreteContour = curve.eval(x)

    axes[i // n, i % n].plot(discreteContour[:, 0], discreteContour[:, 1])
    axes[i // n, i % n].set_title(name)
    axes[i // n, i % n].set_aspect("equal", adjustable="box")

plt.show()
Total running time of the script: (0 minutes 4.585 seconds)