Note
Go to the end to download the full example code.
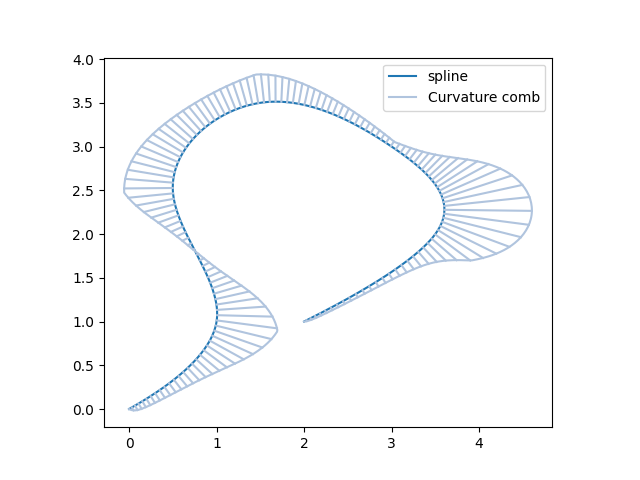
Curvature combs#
In this example we plot the curvature comb of a 2D spline. Curvature combs are useful to highlight changes in curvature.
import matplotlib.pyplot as plt
import numpy as np
import splinebox

M = 7
spline = splinebox.Spline(M=M, basis_function=splinebox.B3(), closed=False)
spline.knots = np.array([[0, 0], [1, 1], [2.5, 0.5], [3.5, 1.5], [3, 3], [2, 3.5], [1, 2]])

t = np.linspace(0, M - 1, 1000)

vals = spline.eval(t)

curvature = spline.curvature(t)
normals = spline.normal(t)

# You can limit the max height of the curvature comb using the factor d.
max_comb_height = 1
d = max_comb_height / np.max(np.abs(curvature))

comb = vals + d * curvature[:, np.newaxis] * normals

plt.plot(vals[:, 1], vals[:, 0], label="spline")
plt.plot(comb[:, 1], comb[:, 0], label="Curvature comb", color="lightsteelblue")
for p in range(0, len(comb), 7):
    plt.plot([vals[p, 1], comb[p, 1]], [vals[p, 0], comb[p, 0]], color="lightsteelblue")
plt.gca().set_aspect("equal", "box")
plt.legend()
plt.show()
Total running time of the script: (0 minutes 2.572 seconds)