splinebox.spline_curves.HermiteSpline.
draw#
- HermiteSpline.draw(x, y)#
Computes whether a point is inside or outside a closed spline on a regular grid of points.
- Parameters:
- xnumpy array
A 1D array containing the x values of the grid of points.
- ynumpy array
A 1D array containing the y values of the grid of points.
- Returns:
- drawingnumpy array
A 2D numpy array of float values. The values indicates the following: 0.0 -> pixel centre lies outside the closed spline. 0.5 -> pixel centre lies on the spline. 1.0 -> pixel centre lies inside the spline.
Examples
>>> import splinebox
>>> import numpy as np
>>> import matplotlib.pyplot as plt
Construct a spline
>>> spline = splinebox.Spline(M=3, basis_function=splinebox.B1(), closed=True)
>>> spline.knots = np.array([[1, 1], [1, 3], [3, 2]])
Compute the points along the spline to plot it as a line.
>>> t = np.linspace(0, 3, 200)
>>> vals = spline(t)
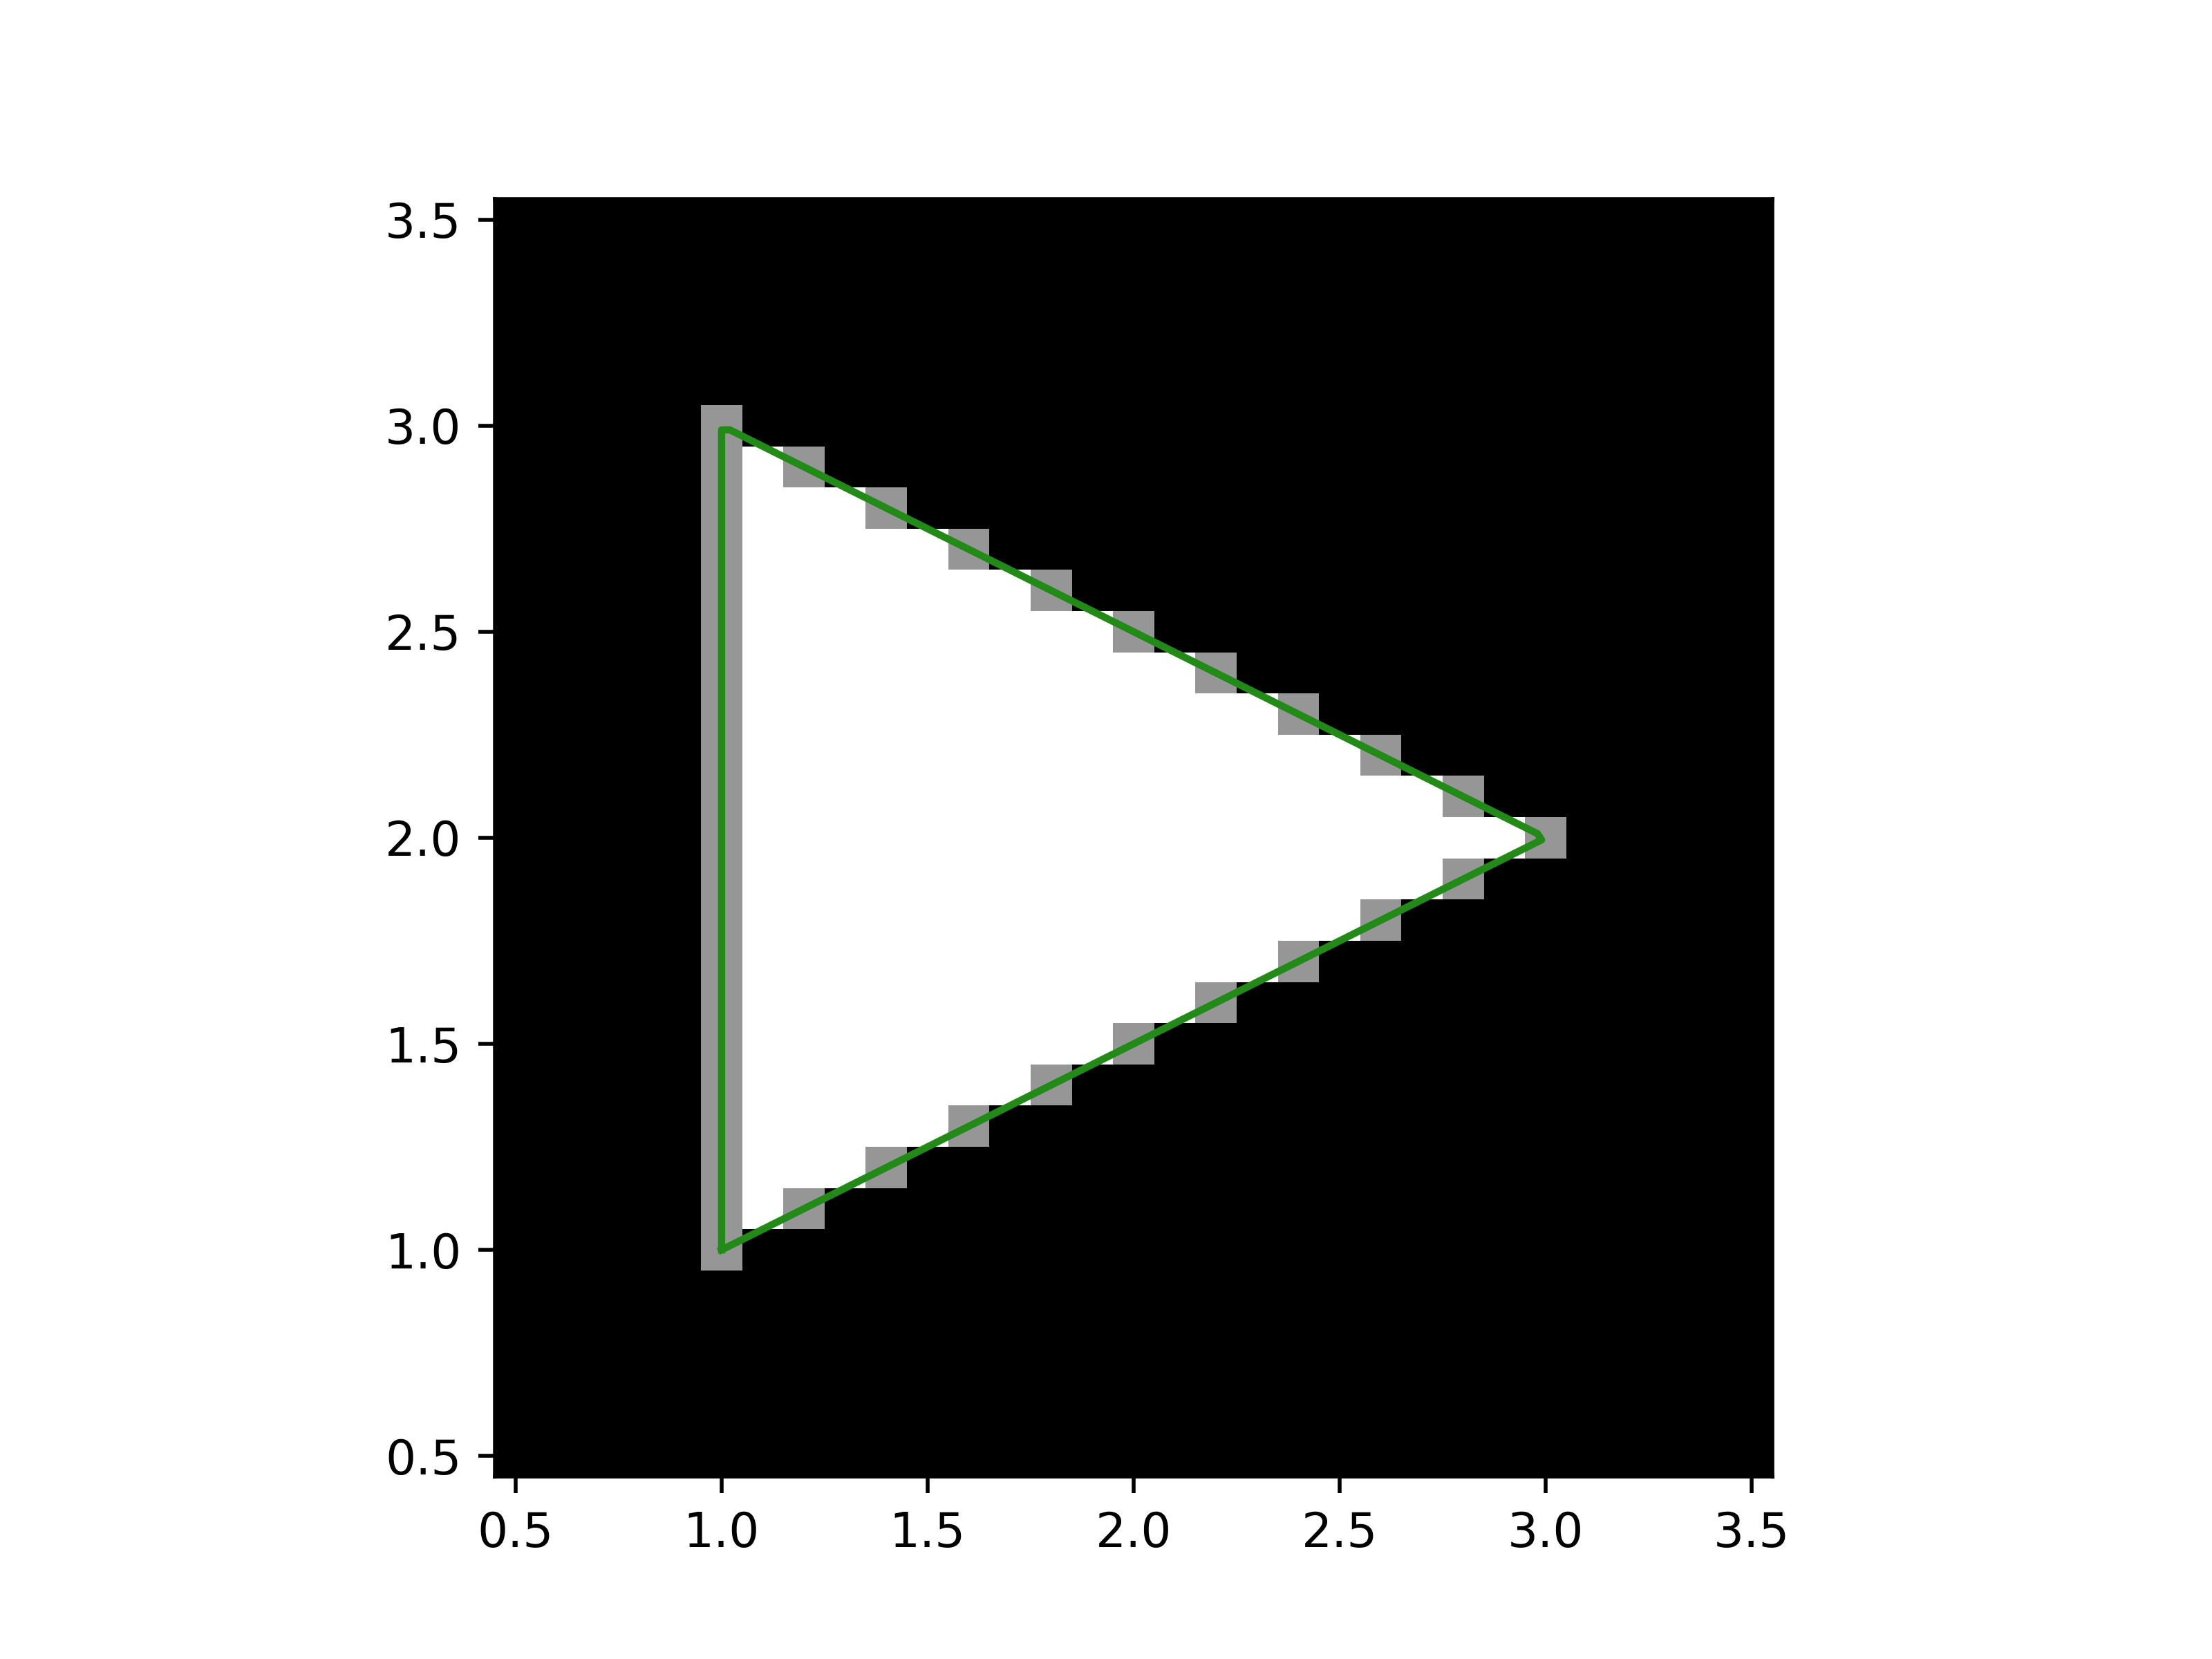
Draw the spline as an image.
>>> pixel_size = 0.1
>>> pixel_centres_x = np.arange(0.5, 3.5 + pixel_size, pixel_size)
>>> pixel_centres_y = np.arange(0.5, 3.5 + pixel_size, pixel_size)
>>> drawing = spline.draw(pixel_centres_x, pixel_centres_y)
>>> print(drawing.shape, drawing.dtype, np.unique(drawing))
(31, 31) float64 [0.  0.5 1. ]
Plot the line and the drawing.
>>> extent = (pixel_centres_x.min() - pixel_size / 2,
...           pixel_centres_x.max() + pixel_size / 2,
...           pixel_centres_y.min() - pixel_size / 2,
...           pixel_centres_y.max() + pixel_size / 2,)
>>> plt.imshow(drawing, cmap="Greys_r", extent=extent)
>>> plt.plot(vals[:, 0], vals[:, 1])
>>> plt.show()