Note
Go to the end to download the full example code.
Spline to mesh#
This guide demonstrates how to convert a 3D spline curve into various types of meshes using SplineBox.
import numpy as np
import pyvista
import splinebox
1. Constructing a Spline#
We begin by creating a circular spline.
M = 4
spline = splinebox.Spline(M=M, basis_function=splinebox.Exponential(M), closed=True)
spline.knots = np.array([[0, 0, 1], [0, 1, 0], [0, 0, -1], [0, -1, 0]])
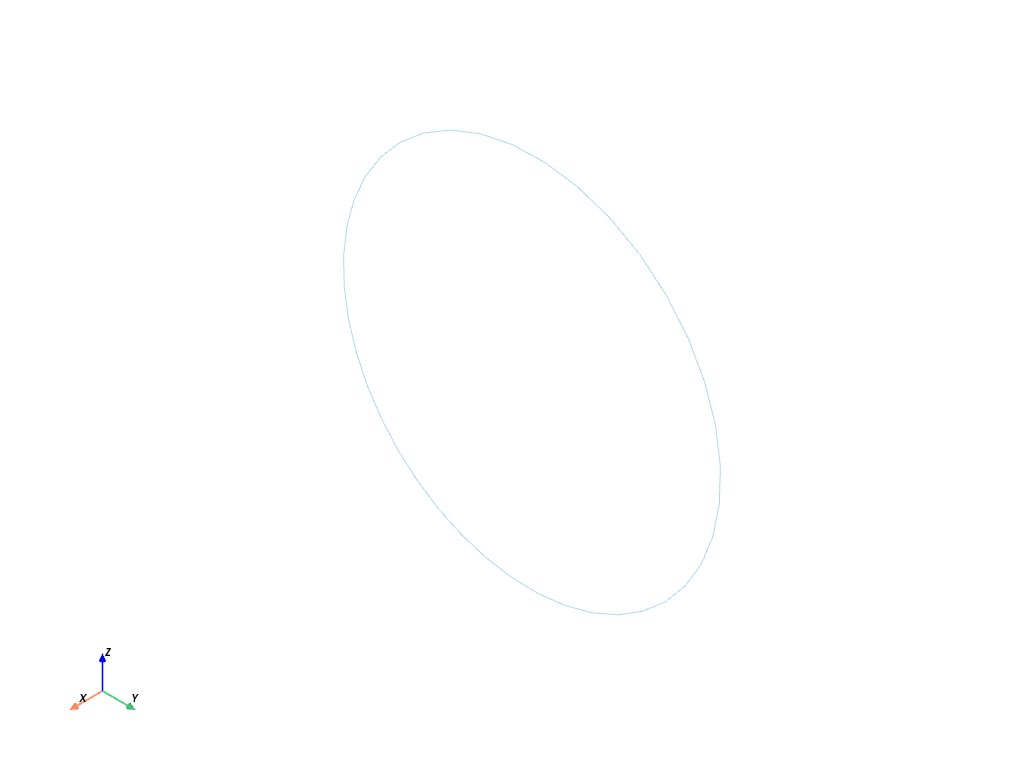
2. Generating a Mesh Without Radius#
The step_t parameter determines the granularity of the resulting mesh, corresponding to the step size in the spline parameter space (t).
Setting the radius to None or 0 results in a line mesh.
# Generate a simple line mesh
points, connectivity = spline.mesh(step_t=0.1, radius=None)

# Prepend the number of points in each element (2 for a line) for PyVista
connectivity = np.hstack((np.full((connectivity.shape[0], 1), 2), connectivity))

# Create and plot the PyVista mesh
mesh = pyvista.PolyData(points, lines=connectivity)
mesh.plot()
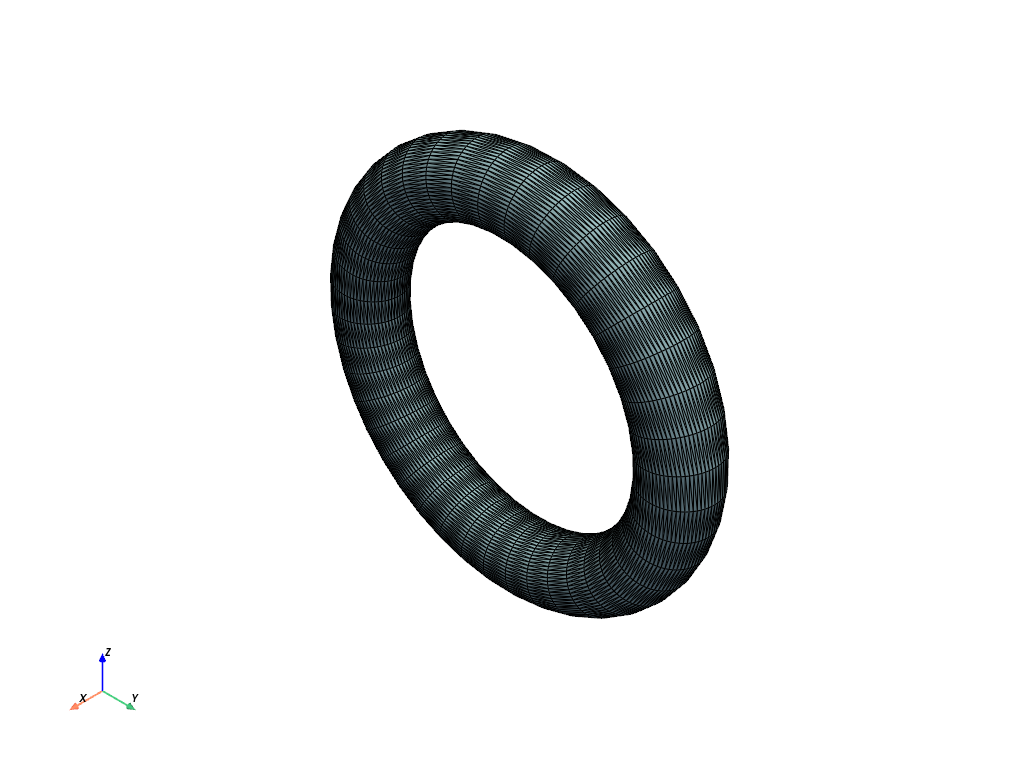
3. Mesh with a Fixed Radius#
Here, we generate a surface mesh (a “tube”) using a fixed radius. We employ the Frenet-Serret frame to avoid selecting an initial vector.
# Generate a surface mesh with a fixed radius
points, connectivity = spline.mesh(step_t=0.1, radius=0.2, frame="frenet")

# Prepend the number of points in each element (3 for triangles) for PyVista
connectivity = np.hstack((np.full((connectivity.shape[0], 1), 3), connectivity))

# Create and plot the PyVista mesh
mesh = pyvista.PolyData(points, faces=connectivity)
mesh.plot(show_edges=True)
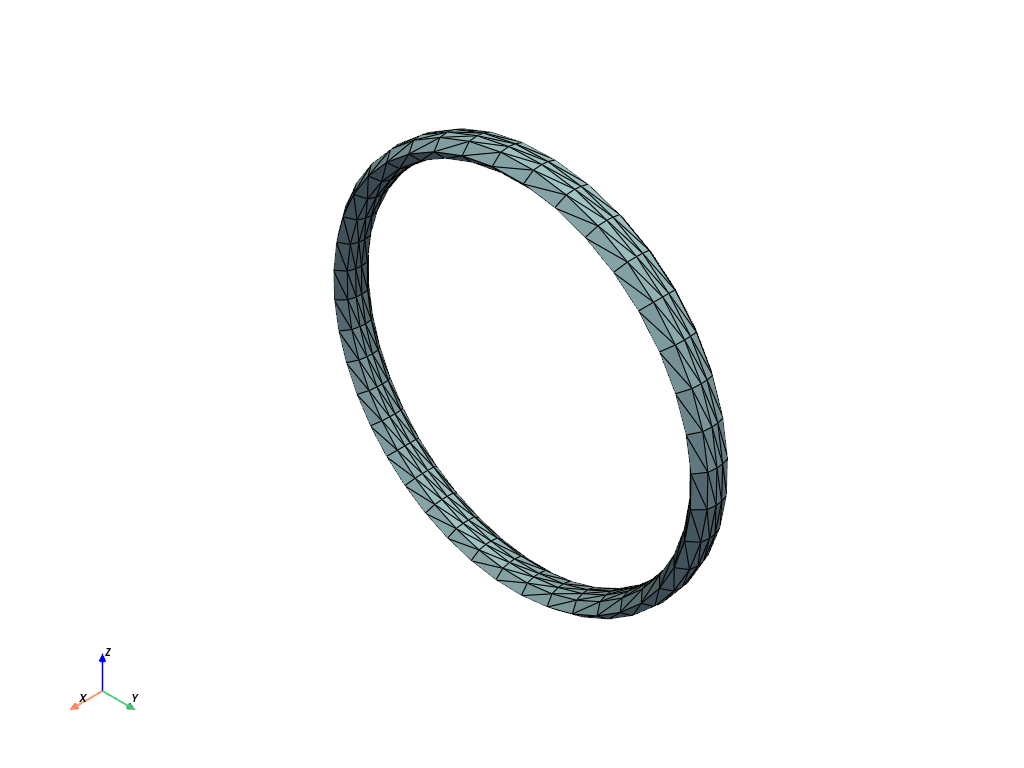
4. Mesh with an Elliptical Cross-Section#
You can define a custom cross-section shape by specifying the radius as a function of the spline parameter (t) and the polar angle (phi).
Example 1: Elliptical Cross-Section
^^^^^^^^^^^^^^^^^^^^^^^^^^^^^^^^^^^
def elliptical_radius(t, phi):
    a = 0.1
    b = 0.05
    phi = np.deg2rad(phi)
    r = (a * b) / np.sqrt((b * np.cos(phi)) ** 2 + (a * np.sin(phi)) ** 2)
    return r


points, connectivity = spline.mesh(step_t=0.1, step_angle=36, radius=elliptical_radius, frame="frenet")

connectivity = np.hstack((np.full((connectivity.shape[0], 1), 3), connectivity))

mesh = pyvista.PolyData(points, faces=connectivity)
mesh.plot(show_edges=True)
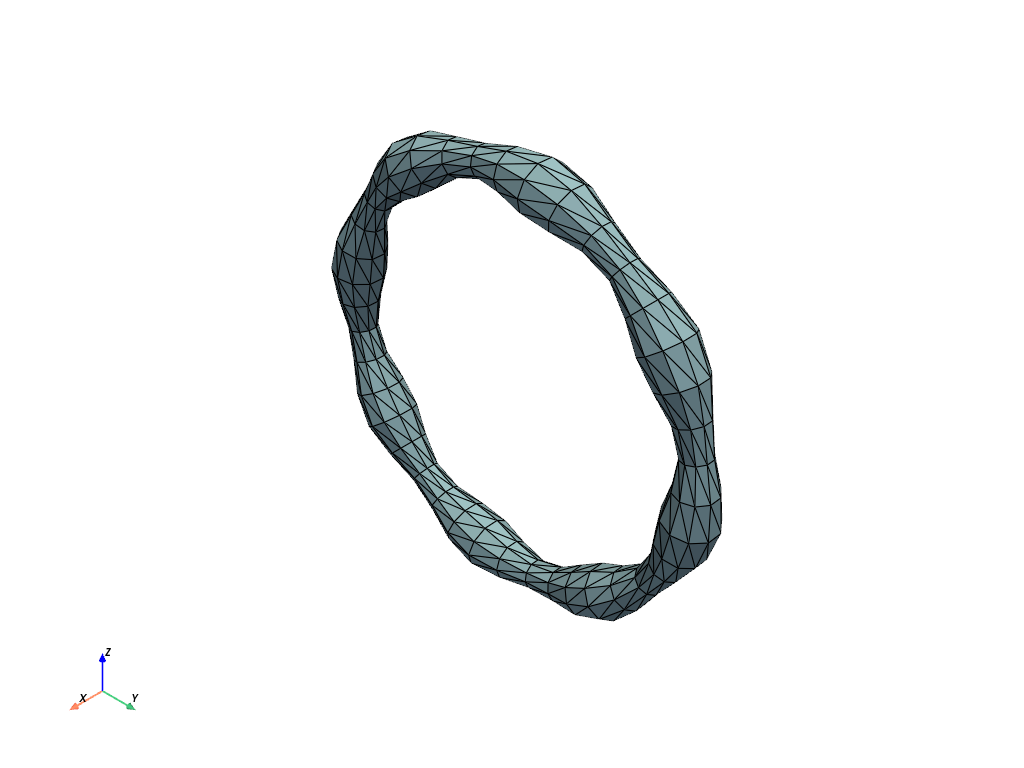
Example 2: Varying Radius Along the Spline#
def radius(t, phi):
    return 0.1 + 0.03 * np.sin(t / spline.M * 16 * np.pi)


points, connectivity = spline.mesh(step_t=0.1, step_angle=36, radius=radius, frame="frenet")

connectivity = np.hstack((np.full((connectivity.shape[0], 1), 3), connectivity))

mesh = pyvista.PolyData(points, faces=connectivity)
mesh.plot(show_edges=True)
5. Bishop Frame for Mesh Generation#
The Frenet-Serret frame is not defined on straight segments and at inflections point. In those cases, we can use the Bishop frame instead. Another advantage of the Bishop frame is that it does not twist around the spline.
Correcting Twists with the Bishop Frame#
# Create a spline with for which the Frenet frame twists
spline = splinebox.Spline(M=M, basis_function=splinebox.B3(), closed=False)
spline.control_points = np.array(
    [
        [0.0, 0.0, 0.0],
        [2.0, 0.0, 0.0],
        [2.0, 2.0, 0.0],
        [2.0, 2.0, 2.0],
        [0.0, 2.0, 2.0],
        [0.0, 0.0, 0.0],
    ]
)

points, connectivity = spline.mesh(step_t=0.1, step_angle=36, radius=elliptical_radius, frame="frenet")

connectivity = np.hstack((np.full((connectivity.shape[0], 1), 3), connectivity))

mesh = pyvista.PolyData(points, faces=connectivity)
mesh.plot(show_edges=True)
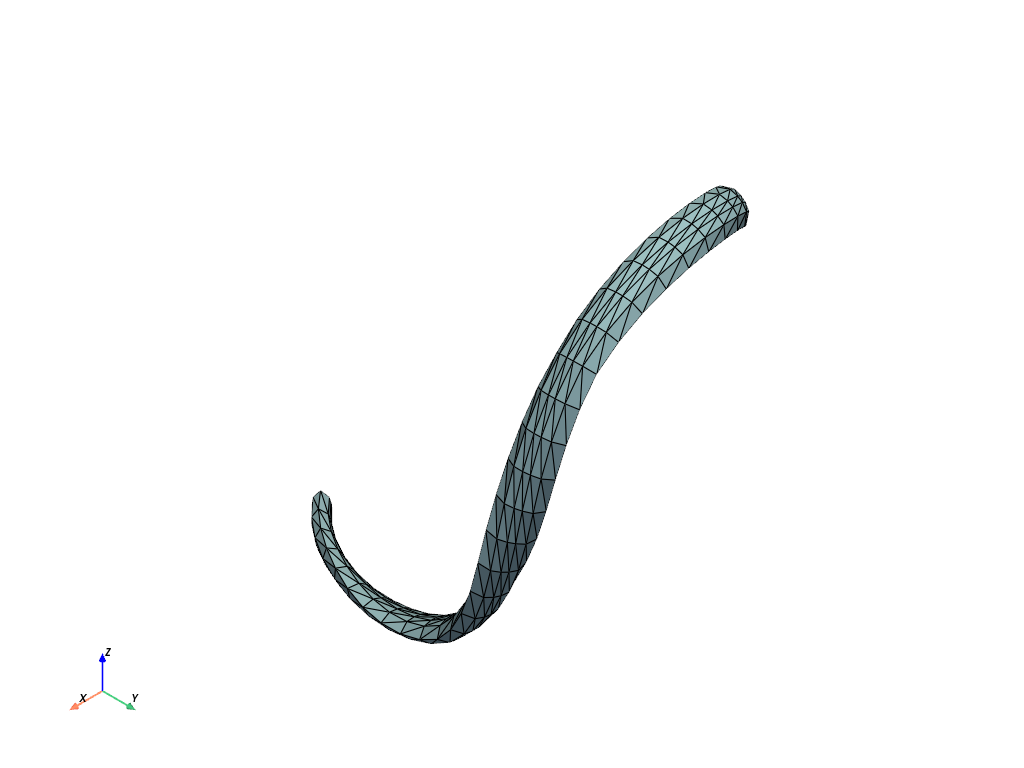
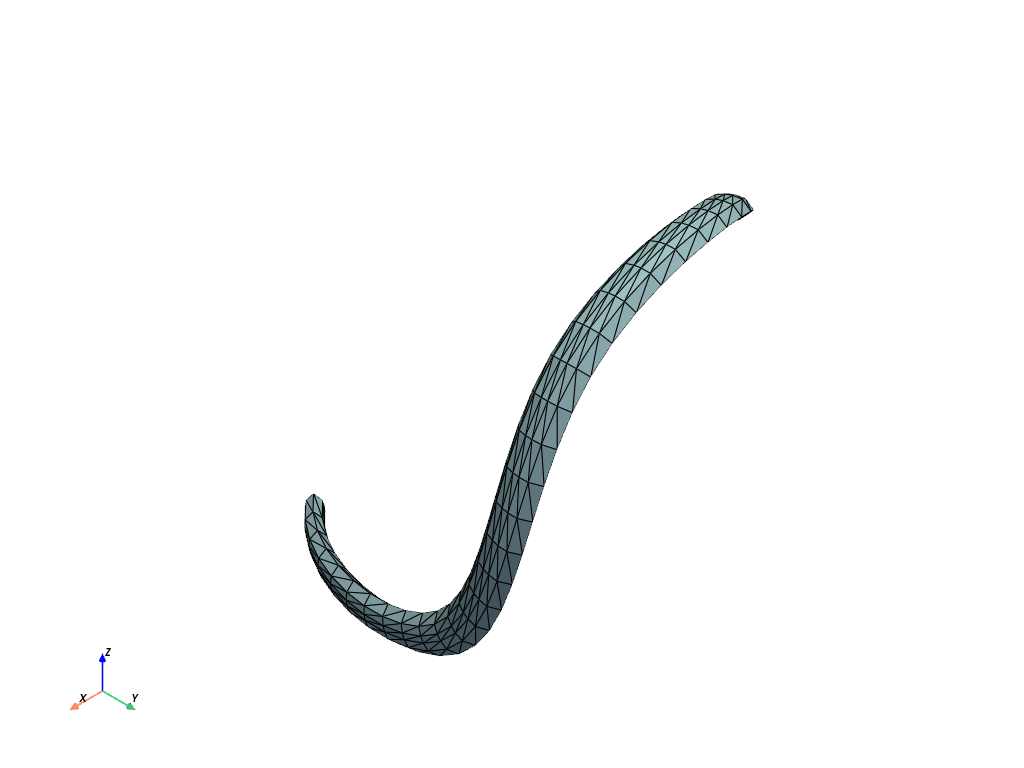
You can clearly see how the ellipse twists around the spline. The Bishop frame eliminates this twist.
points, connectivity = spline.mesh(step_t=0.1, step_angle=36, radius=elliptical_radius, frame="bishop")

connectivity = np.hstack((np.full((connectivity.shape[0], 1), 3), connectivity))

mesh = pyvista.PolyData(points, faces=connectivity)
mesh.plot(show_edges=True)
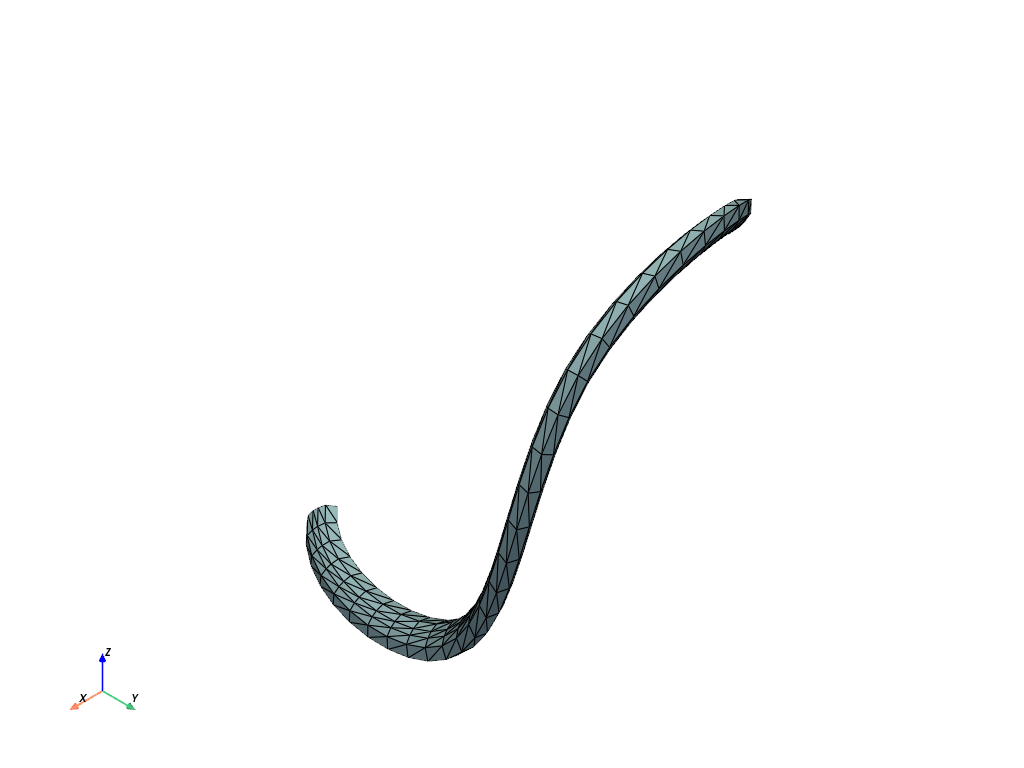
Changing the initial vector rotates the frame and therefore the ellipse.
initial_vector = np.array([0.5, -0.5, 1])

points, connectivity = spline.mesh(
    step_t=0.1, step_angle=36, radius=elliptical_radius, frame="bishop", initial_vector=initial_vector
)

connectivity = np.hstack((np.full((connectivity.shape[0], 1), 3), connectivity))

mesh = pyvista.PolyData(points, faces=connectivity)
mesh.plot(show_edges=True)
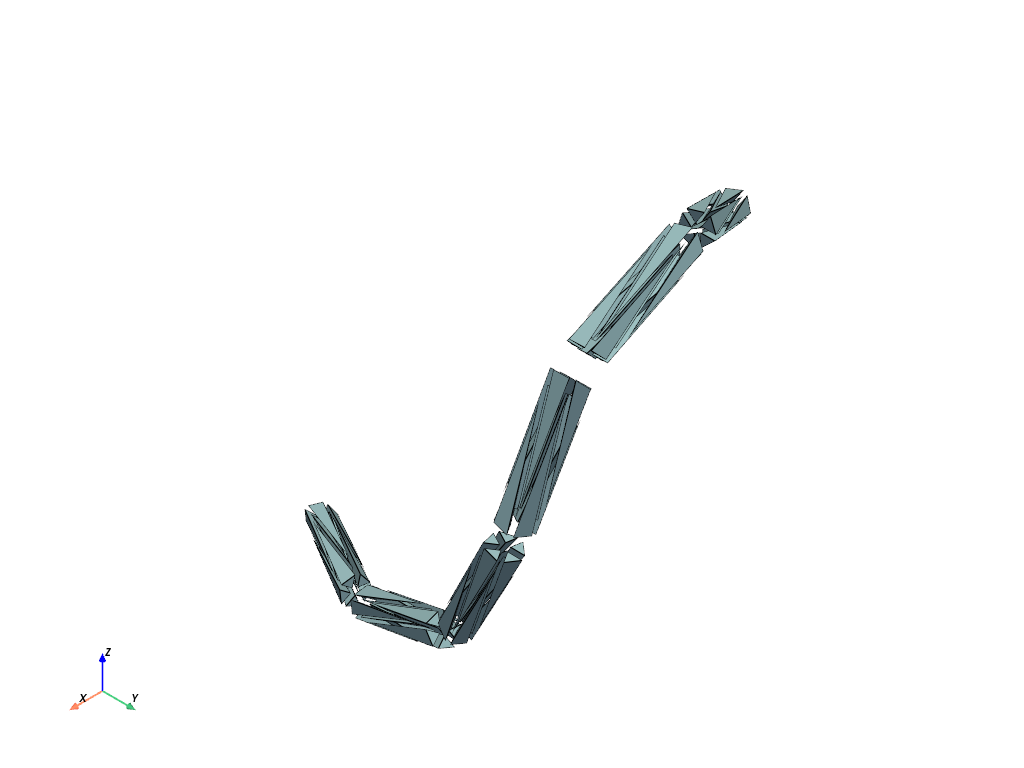
6. Volume Mesh#
Finally, you can generate a volumetric mesh by setting the mesh_type to "volume".
points, connectivity = spline.mesh(
    radius=radius, step_t=0.5, step_angle=72, initial_vector=initial_vector, mesh_type="volume"
)

connectivity = np.hstack((np.full((connectivity.shape[0], 1), 4), connectivity))
cell_types = np.full(len(connectivity), fill_value=pyvista.CellType.TETRA, dtype=np.uint8)

mesh = pyvista.UnstructuredGrid(connectivity, cell_types, points)
mesh.plot(show_edges=True)
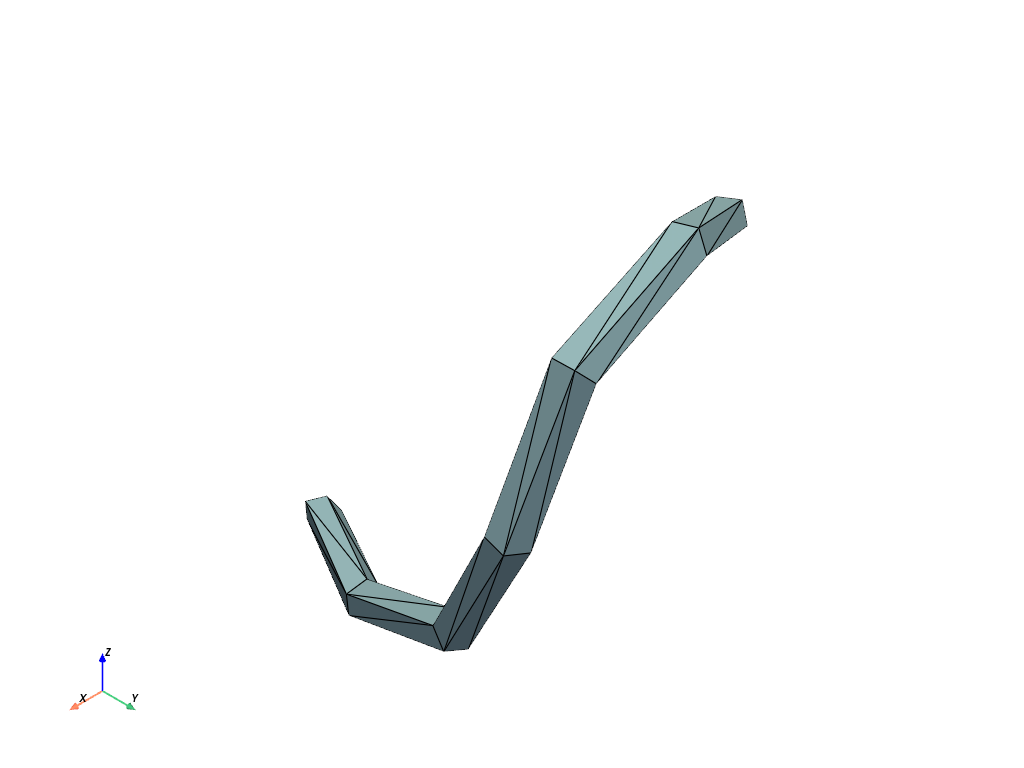
For a better understanding of the volume mesh we can explode it. This allows us to see the individual tetrahedra.
mesh.explode(factor=0.5).plot(show_edges=True)
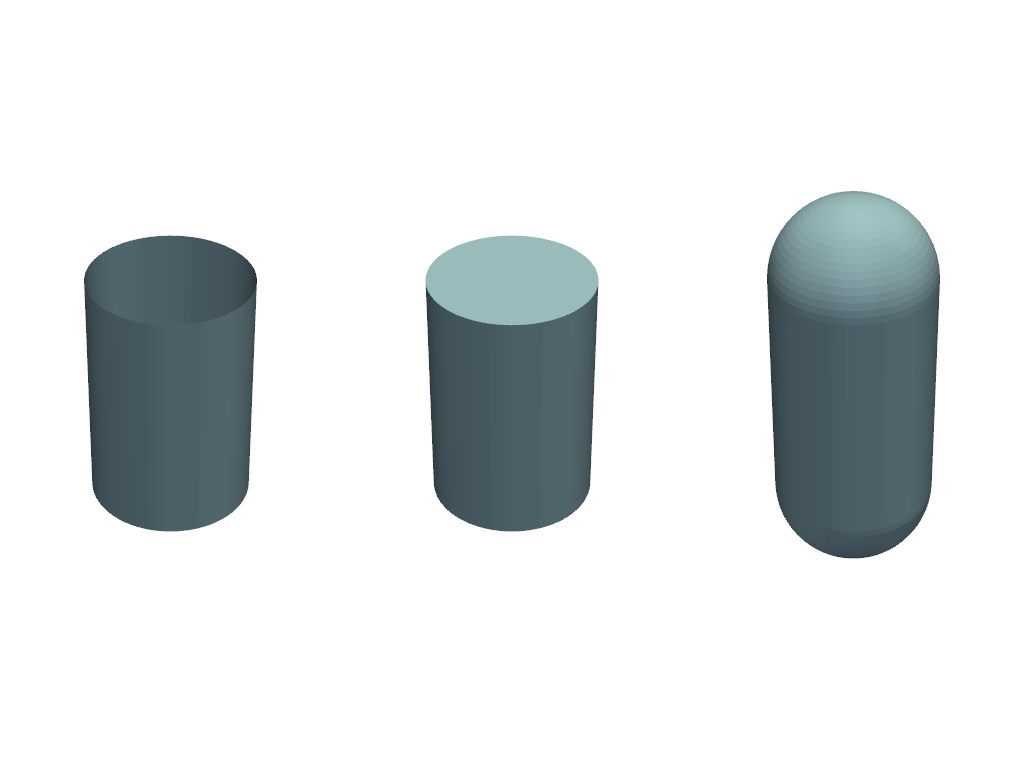
7. Mesh with Capped Ends#
To create a closed surface mesh for an open spline, the ends can be capped.
M = 4
spline = splinebox.Spline(M=M, basis_function=splinebox.B3(), closed=False)
spline.knots = np.array([[0, 0, 0], [0, 0, 1], [0, 0, 2], [0, 0, 3]])
SplineBox offers two different options to cap the end: 1. With an orthogonal flat plane 2. With a hemisphere
points_open, connectivity_open = spline.mesh(radius=1, cap_ends=None)
points_flat, connectivity_flat = spline.mesh(radius=1, cap_ends="flat")
points_sphe, connectivity_sphe = spline.mesh(radius=1, cap_ends="sphere")

connectivity_open = np.hstack((np.full((connectivity_open.shape[0], 1), 3), connectivity_open))
connectivity_flat = np.hstack((np.full((connectivity_flat.shape[0], 1), 3), connectivity_flat))
connectivity_sphe = np.hstack((np.full((connectivity_sphe.shape[0], 1), 3), connectivity_sphe))

mesh_open = pyvista.PolyData(points_open, faces=connectivity_open)
mesh_flat = pyvista.PolyData(points_flat, faces=connectivity_flat)
mesh_sphe = pyvista.PolyData(points_sphe, faces=connectivity_sphe)

plotter = pyvista.Plotter(shape=(1, 3), border=False)
plotter.subplot(0, 0)
plotter.add_mesh(mesh_open)
plotter.subplot(0, 1)
plotter.add_mesh(mesh_flat)
plotter.subplot(0, 2)
plotter.add_mesh(mesh_sphe)
plotter.link_views()
plotter.show()
Tips#
Save meshes for visualization in ParaView using
mesh.save("mesh.vtk").
Total running time of the script: (0 minutes 1.714 seconds)