Note
Go to the end to download the full example code.
Plot 3D curvature#
This example shows how to plot curvature combs in 3D or how to color the spline based on the local curvature. Both options are illustrated in pyvista and matplotlib.
import matplotlib.pyplot as plt
import mpl_toolkits
import numpy as np
import pyvista
import splinebox
1. Construct as random spline#
M = 4
spline = splinebox.Spline(M=M, basis_function=splinebox.B3(), closed=False)
np.random.seed(0)
spline.control_points = np.random.rand(M + 2, 3)

t = np.linspace(0, M - 1, M * 15)

vals = spline(t)
2. Curvature comb with pyvista#
mesh = pyvista.MultipleLines(points=vals)

curvature = spline.curvature(t)

normals = spline.normal(t, frame="frenet")
normal = -normals[:, 0]

comb = vals + curvature[:, np.newaxis] / 100 * normal

comb_mesh_points = np.zeros((comb.shape[0] * 3 - 1, 3))
comb_mesh_points[0::3] = vals
comb_mesh_points[1::3] = comb
comb_mesh_points[2::3] = comb[1:]
comb_mesh = pyvista.MultipleLines(points=comb_mesh_points)

plotter = pyvista.Plotter()
plotter.add_mesh(mesh, color="blue")
plotter.add_mesh(comb_mesh, color="lightblue")
plotter.show()

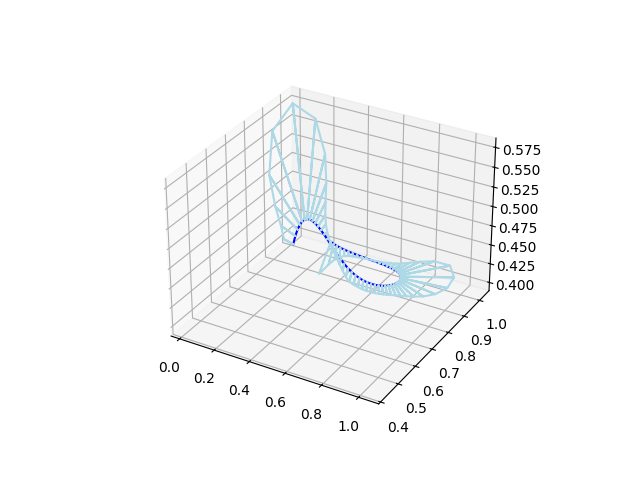
3. Curvature comb with matplotlib#
ax = plt.figure().add_subplot(projection="3d")
ax.plot(vals[:, 2], vals[:, 1], vals[:, 0], color="blue")
ax.plot(comb_mesh_points[:, 2], comb_mesh_points[:, 1], comb_mesh_points[:, 0], color="lightblue")
plt.show()
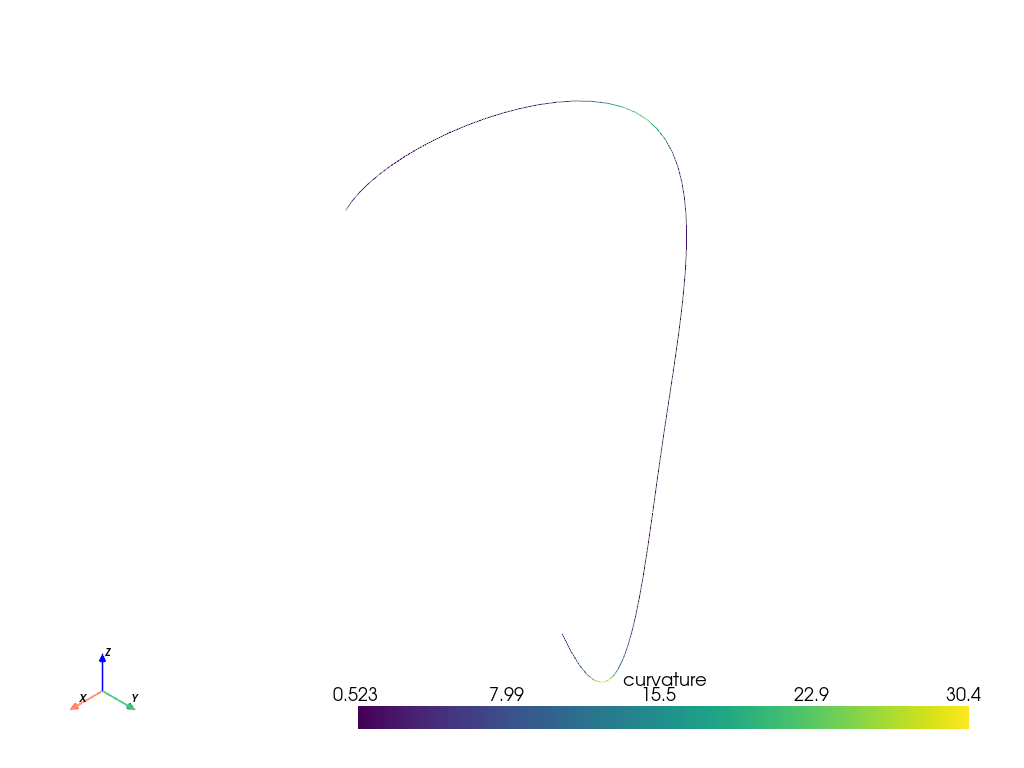
4. Colour with pyvista#
We start with a simple line.
points, connectivity = spline.mesh(step_t=t[1] - t[0], radius=None)
connectivity = np.hstack((np.full((connectivity.shape[0], 1), 2), connectivity))
mesh = pyvista.PolyData(points, lines=connectivity)
mesh.cell_data["curvature"] = spline.curvature(t[:-1] + np.diff(t))
mesh.plot()
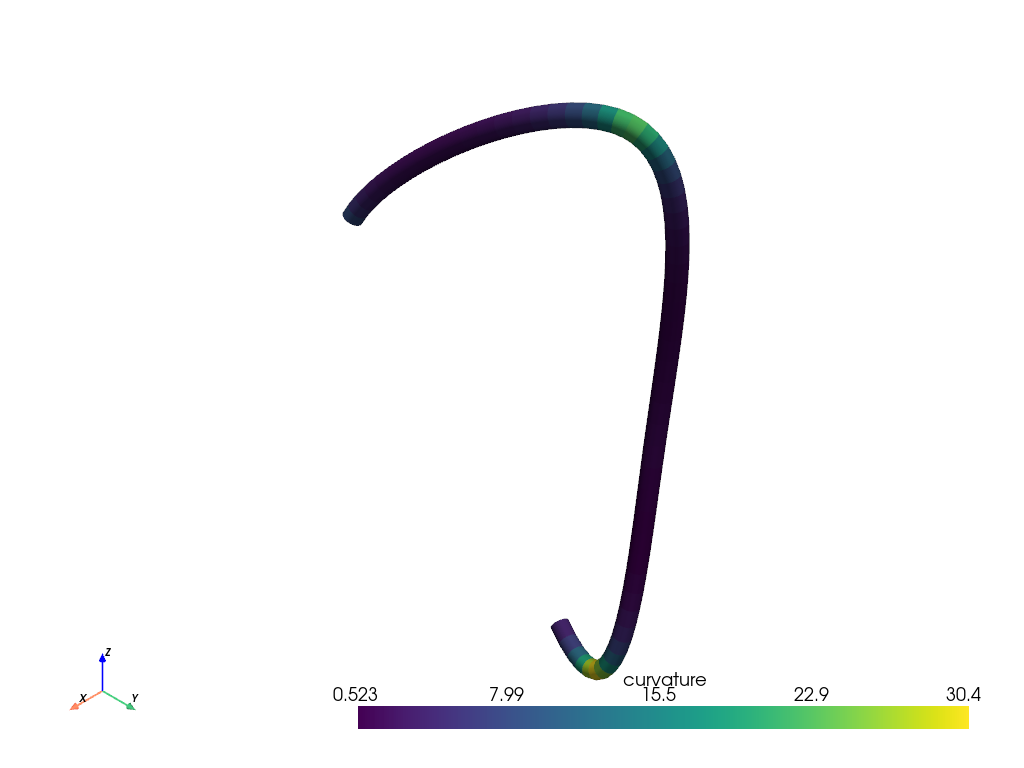
To control the thickness of the the line we can use a mesh
points, connectivity = spline.mesh(step_t=t[1] - t[0], radius=0.01)
connectivity = np.hstack((np.full((connectivity.shape[0], 1), 3), connectivity))
mesh = pyvista.PolyData(points, faces=connectivity)
segment_curvature = spline.curvature(t[:-1] + np.diff(t))
mesh.cell_data["curvature"] = np.repeat(segment_curvature, len(connectivity) / len(segment_curvature))
mesh.plot()
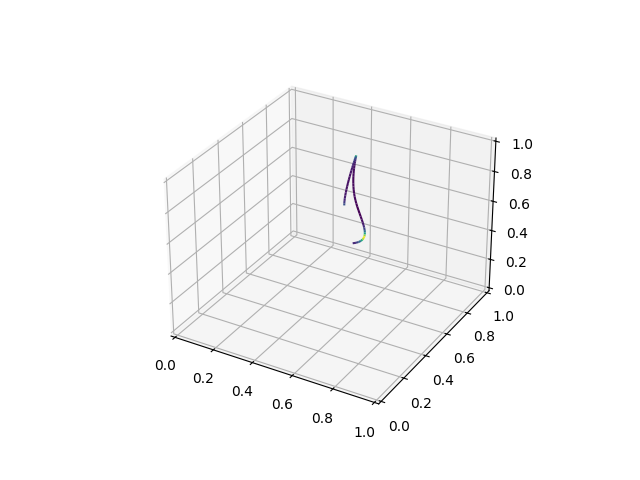
5. Colour with matplotlib#
ax = plt.figure().add_subplot(projection="3d")
segments = np.stack([vals[:-1], vals[1:]], axis=1)
lc = mpl_toolkits.mplot3d.art3d.Line3DCollection(segments)
lc.set_array(segment_curvature)
ax.add_collection(lc)
plt.show()
Total running time of the script: (0 minutes 1.667 seconds)